Around 95% of UK imports and exports are transported by sea. The companies and ports that handle this freight must submit data about their activity to the Department for Transport. This data reveals trends and patterns which we use to inform policy decisions.
The people who provide port freight data are employees of ports, shipping lines and shipping agents. Most of them do this by using a 10 years old website that only runs on specific web browsers. Our Maritime Statistics colleagues asked us to review the current process and see whether a new system could be developed, in line with the Digital Service Standard.
So we have just completed a discovery, looking into users’ experience of providing this data to DfT. A discovery is a phase of work that helps us understand and articulate a set of needs so we can propose a way of meeting them.
Setting sail
We started by forming a multidisciplinary team of policy experts, designers, user researchers and technical specialists. We recruited and interviewed 40 users, which included a mix of:
- user type (ports, shipping lines and agents)
- size (for ports, measured by annual tonnage; for agents, by number of data submissions)
- submission method (website, automatic export, emailed spreadsheet)
- region
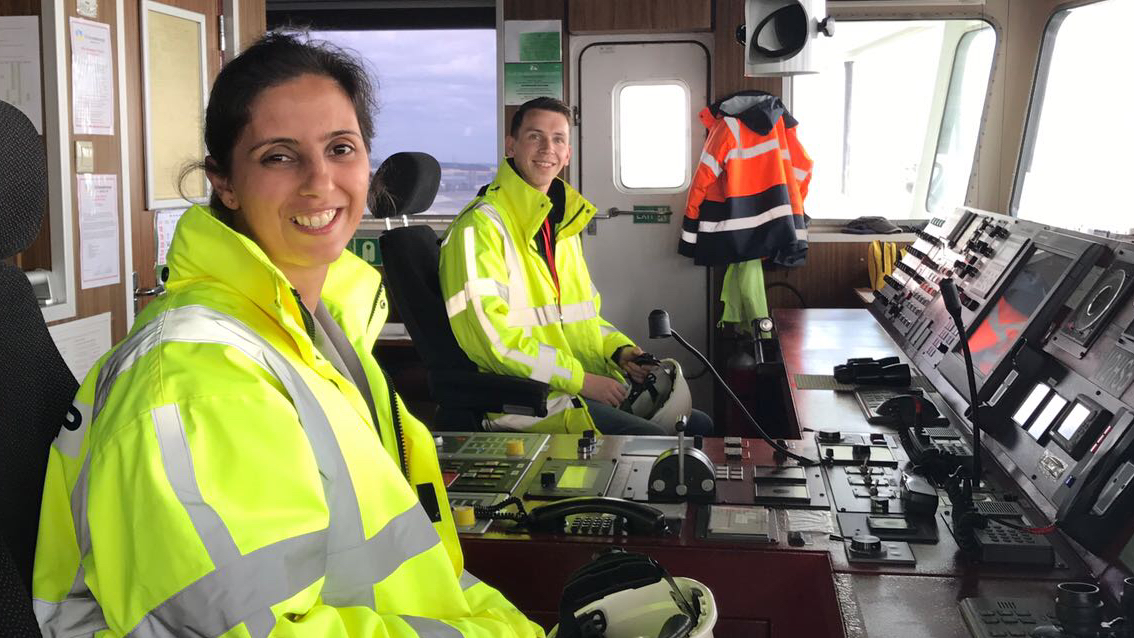
User research works best when you observe the person in their own environment, using the service you’re looking to improve. This can reveal frustrations and workarounds that they might otherwise not mention. So we visited users based at ports such as Southampton, Grimsby and Sheerness, as well as doing a number of interviews by phone. We also ran a survey and received 47 complete responses.
What we found
Ports are an integral part of our national infrastructure and a real eye opener in terms of the diversity and scale of cargoes that pass through them. A blog post can’t accommodate all the findings, but here are a few:
Users compile and submit data to DfT because they’re required by law to do so. Most are in operational roles, making sure ships collect and deliver their cargo efficiently. At best, reporting on port freight is a small part of the job. At worst, it can get in the way of them doing their job. While it's never going to be top of their priority list, there are frustrations with the existing process. This suggests opportunities to reduce the burden, even if we can’t remove it completely.
The website that most of them use doesn’t reflect advances in user-centred design that is now standard practice. Yet some users don’t report website problems, assuming it’s their fault. Sometimes people say they’re happy with how things are, but it’s more a case of them having low expectations of a government website and being accustomed to its quirks. One quote on our research wall said: “The website is easy to use, once you know how”. So is speaking German, as one of our colleagues commented!
Although the website falls below expectations, using it is often less time consuming than compiling the data to put in it. Most users must source the data from various separate data systems or even paper files. Time taken can vary from five minutes to several days, depending on factors such as:
- the number of port calls made
- the diversity of cargoes shipped
- the technical maturity of the system used to run the user’s business.
Statistics are data, and data works best when it’s standardised. Although port freight depends on standards such as shipping container sizes, managing port freight operations isn’t standardised across the industry. Difficulties can arise from things like two organisations having a different version of the same dataset. Also, the cargo categories required in port freight statistics aren’t used elsewhere, and they don’t match how those in the industry categorise and describe their cargo. It seems we could do more to help align their view of the world with ours and reduce errors when the wrong category code is used.
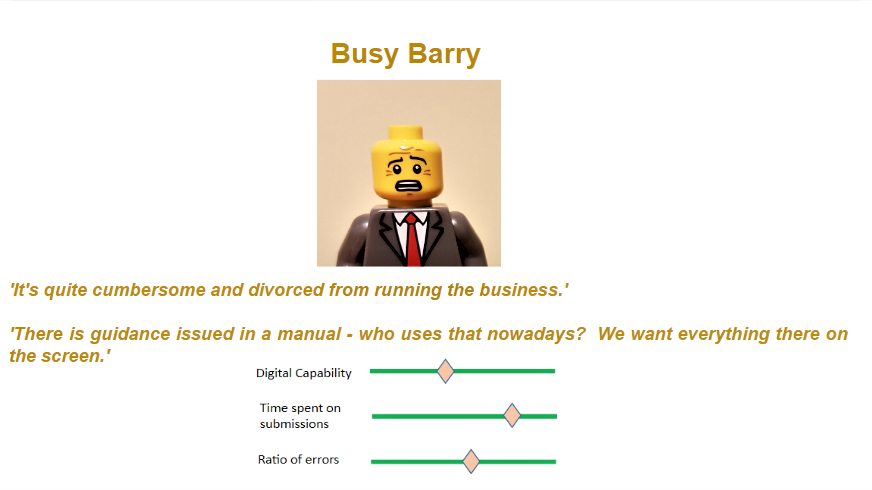
Making it persona(l)
A key output of any discovery is a set of user personas. A persona is a tool for compressing research data and making it more usable and digestible. We came up with five personas, including three data suppliers, the contractor who collects the data and even our policy colleagues from across the office. Images often come with copyright restrictions, and stock photos can look a bit generic so, for the persona pictures, we used Lego figures borrowed from a family member. Here’s one:
Next port of call?
The user research process is about going from observations to findings to actions. Any bad stuff we uncover is good if it presents an opportunity to make things better. We’ve presented our findings to our maritime colleagues and proposed an approach to incrementally deliver and test these opportunities (starting with an alpha). This would start with prototyping and further continuous engagement with users to ensure the service makes the reporting process as easy and error-free as it can be. Watch this space!