Making it easier to find and use data will help us do our jobs better - improving services and developing evidence based policy. That’s what our digital data index is all about.
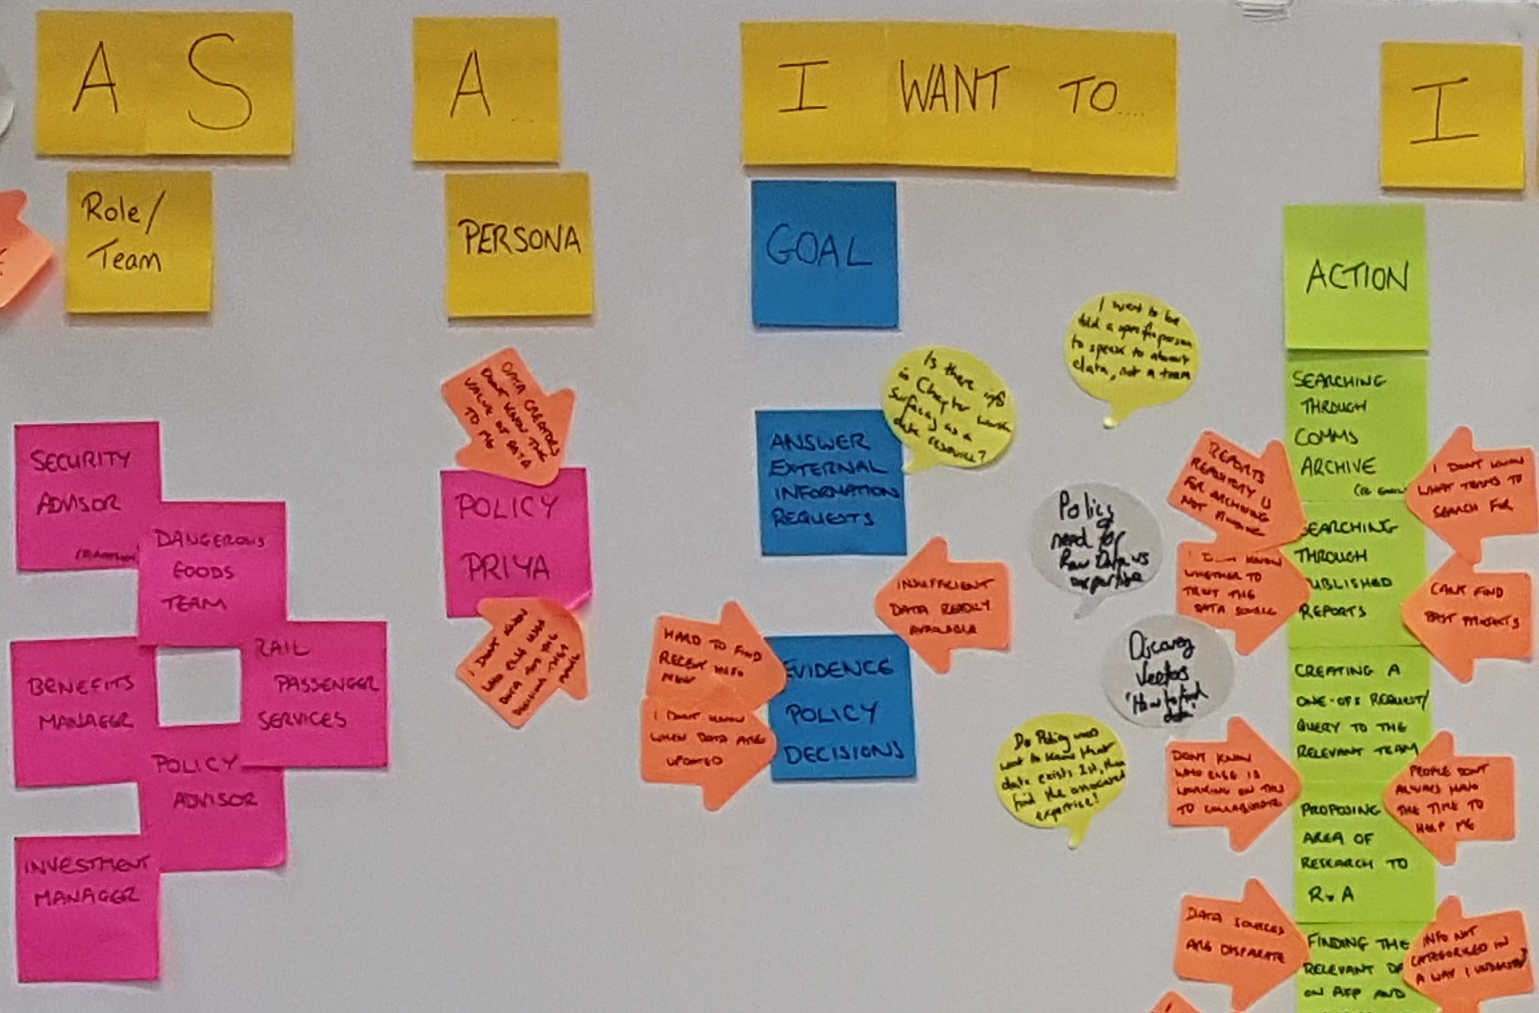
The discovery phase provided a rich seam of knowledge to inform the next phase: alpha. During discovery, we learned lots about colleagues who use the department’s transport data and what their needs are. From that research we developed a set of 4 personas, representing real users from the policy, statistics, modelling and research and analysis areas.
We were keen to move quickly into alpha so we can get on with building prototypes for an index and put those in front of people. But we haven’t stopped talking to our users - quite the opposite. We are continuing to hold more in-depth interviews with them to validate and update our personas (though they have stood up pretty well so far). And we have set up a user group alongside our steering group to ensure our users can hold us to account. That’s a bit scary, but it keeps us on our toes!
What’s the story?
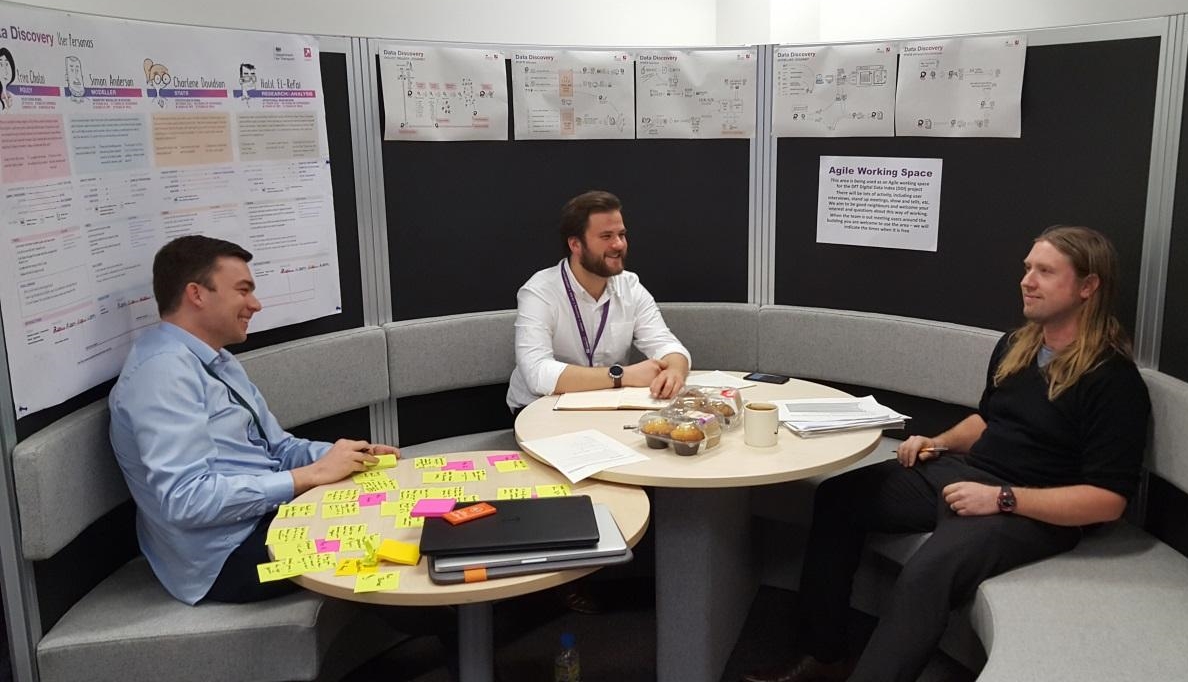
To be as open as possible, we set up an agile area in a different part of the building for each phase. One of the first things we did once we had pinned up the bunting in our new alpha space was to draw up a user storyboard. This looks a bit like a cartoon storyboard. We take a persona (in this case, Priya, our policy user persona) and draw what her ideal ‘journey’ might be when she needs to gather evidence for a report. We’ll then test this journey with policy colleagues who identify any pain points in the process that need fixing. We will adjust the storyboard as we go, to help develop prototypes that work well in real life. Then we’ll build a prototype and ask users to try it out.
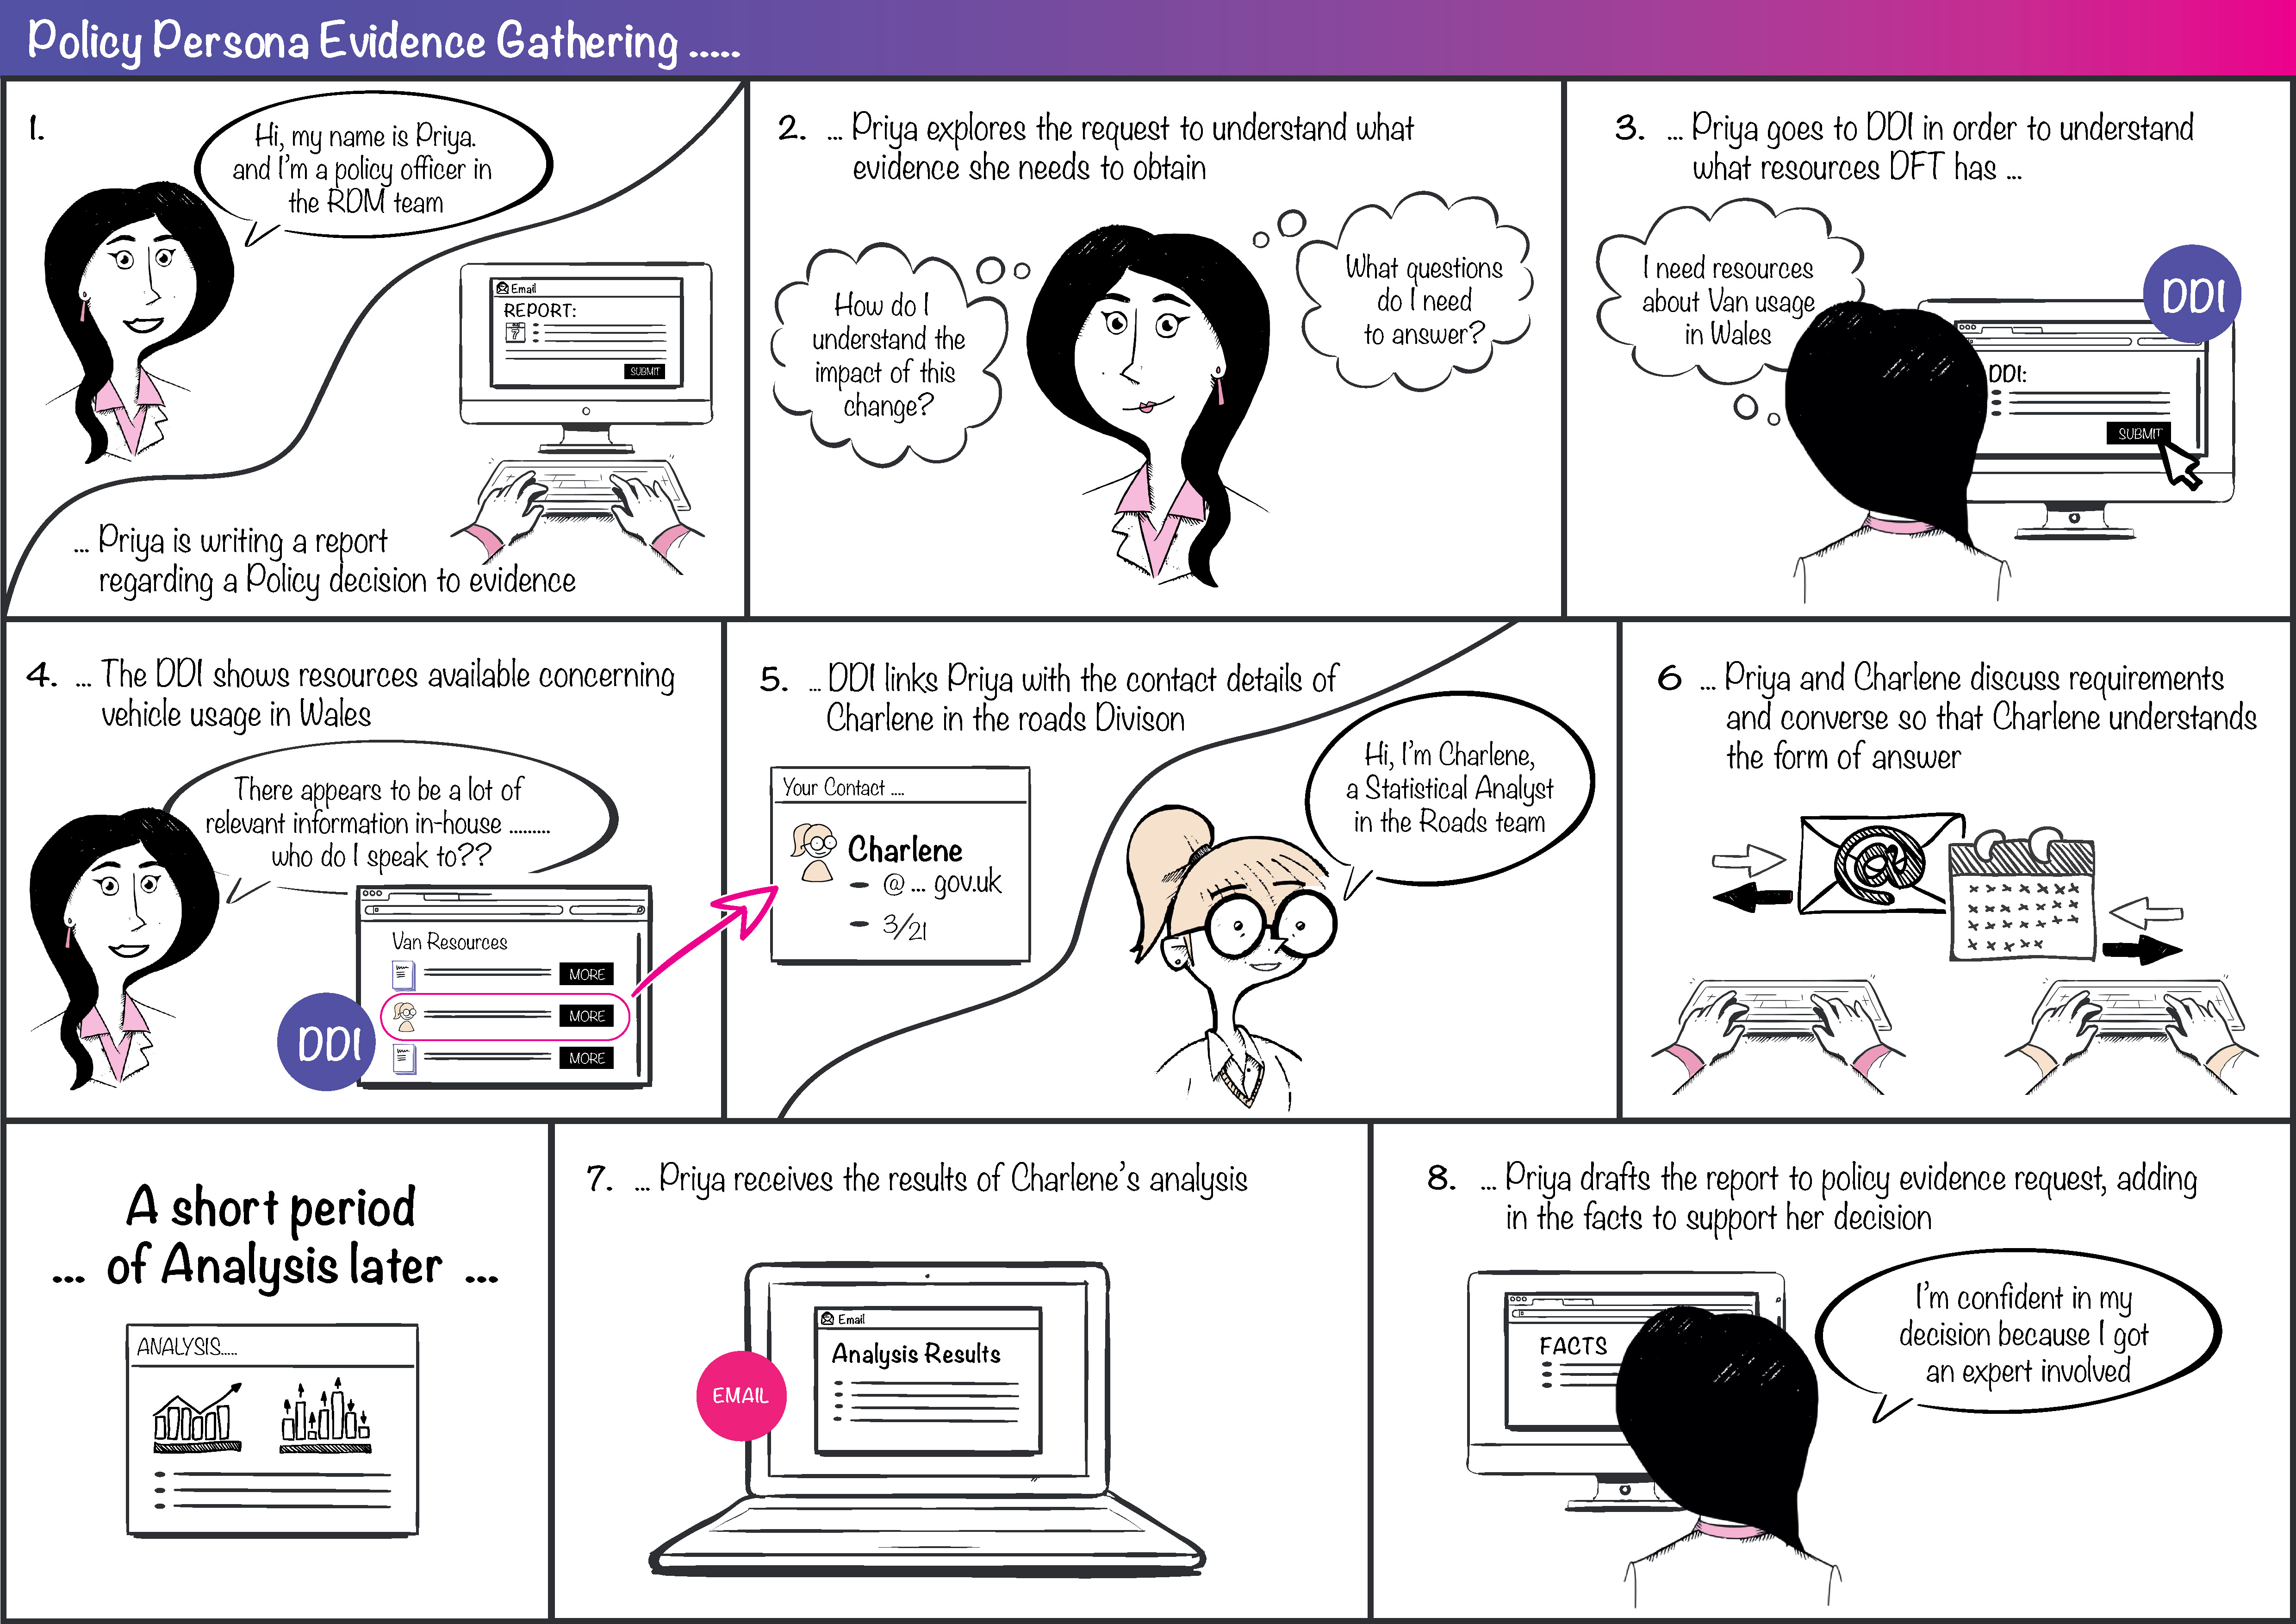
It’s a great technique and we are doing the same for our other 3 personas.
Joining the dots
What else are we up to? Lots. We’re looking in much more detail at the data itself, joining the dots between where data is and how users want to go about finding it. For instance, some want to go straight to the raw data, others want to find an expert who can explain it to them. It’s an important area to understand, and we’ve coined the phrase ‘discovery vectors’ to describe what we’re doing. Our research is telling us that users need to find information in all sorts of ways: by place, team, mode of transport, theme, phrase and keyword.
We’re finding out in more detail:
- how our users need to discover data and information in different circumstances
- what methods they use
- what questions they ask during their search (for example, by analysing emails of data requests made to our statisticians)
- what factors contribute to the ‘moment of truth’ when users find the information they need
We’ll capture all this in a service blueprint - a set of key requirements that will determine what form the service needs to take. And, of course, we’ll share this and other outcomes of alpha on this blog.
Talk is cheap
The continued increase in availability of data represents a great opportunity to improve public services. So we’re not the only ones trying to make it easier to exploit this opportunity. During discovery and into alpha, we’ve met up with colleagues from other departments across government and learned from each other. If you’d like to find out more or share your experience of making data easier to find, please comment below or drop us a line at DiscoverDigital@dft.gsi.gov.uk