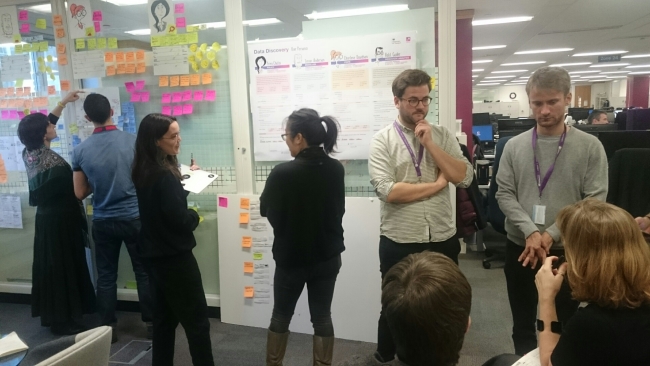
We recently blogged about the start of our project to see if we could create an index for our data to make it easier to find and use. The first step was to speak with colleagues to find out what data we have and how they use it. So what have we learned?
We have a lot of data
We began by taking inventory - gathering and combining the results of several earlier data collection exercises. Further datasets came to light during our interviews with colleagues from all round the department. Starting from a master list of over 2,000 datasets, we narrowed it down to a core list of 473.
The metadata describing these datasets varies in format and completeness. In our next phase (Alpha) we’ll try to understand more about what users need the metadata to look like.
The problem wasn’t where we thought it was
For some colleagues, finding data is a harder task than for others. Our stats teams have fewer problems than others finding the data they need. Not surprising, since interpreting and explaining data is their main job. But policy colleagues can find it challenging, especially when they’re working on something new.
We thought the biggest need would be with the most data-literate users. But actually we found that they are often very close to source of the data. It’s different for those that don’t work directly with data. These users need data to inform their work but often don’t know what’s available or where to find it.
We made some new friends
We’re a big department, with all kinds of people doing all kinds of jobs. To help us keep track of who needs what, we created 4 personas to guide us through to Alpha. We’ll be iterating these as we keep researching and understanding more about our users.
Meet Priya, Simon, Charlene and Halil:

Priya works in policy. She has to work on different projects often and needs to draw on the advice and expertise of others within the department to inform her work.
Simon works as a transport modeller. He continuously updates and improves his models, drawing on the best available data. His work is technically complex, and he typically works on the same kinds of problems for a long time.
Charlene is a statistician. She takes raw data and processes it to produce statistical reports. She’s an expert on her data, and fields lots of incoming requests from the department and from the public.
Halil is an operational researcher. He provides decision makers and internal teams with analysis on a range of topics, drawing on a broad base of analytical disciplines.
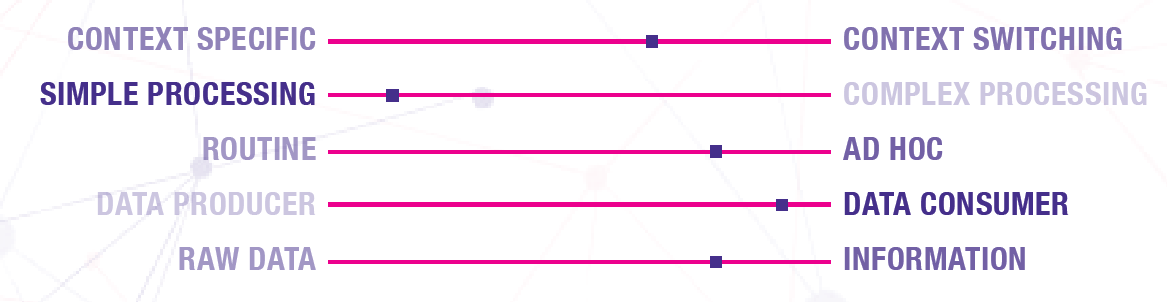
Simple scales make complexity clearer
We found some core factors that affect what users need from the service. For instance, some users work with the same topics most of the time, whilst others often switch between topics. Those that switch often need to quickly understand what data is available for a subject area that is new to them. Those that usually work in the same area need to keep on top of changes and developments in the data.
Creating a scale of these factors for each of our personas helped us see at a glance the kinds of needs each persona has.
Data is a team sport
One of our initial hypotheses was that users needed something to point them directly to the department’s data so that they could analyse it. This wasn’t true in all cases. Many are happy working with raw data, others need to find data experts to help them.
We mapped journeys for all of our personas. From answering a question from Parliament to creating reports from road surveys, we learned a lot about the kinds of work people are doing with data, and how they get it done. Work is often highly collaborative, and the main frustration can be finding who it is you need to collaborate with.
We think a tool for finding experts by the data they work with could make these collaborations work much more smoothly. Our Alpha phase, which begins later this month, will explore how we can connect experts with those that need their help.
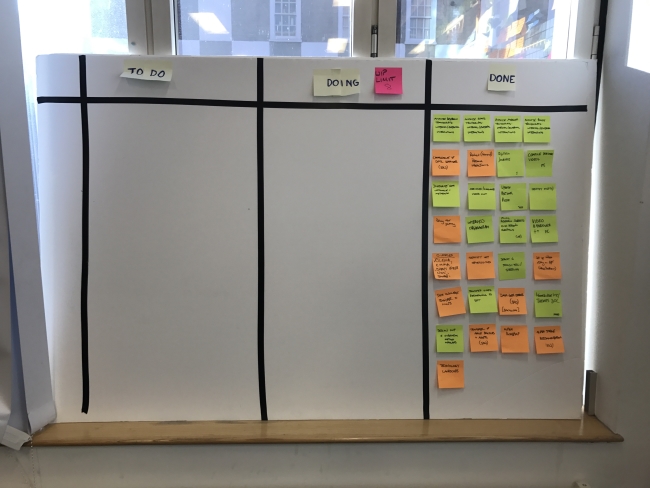
What now?
During Alpha, we'll build and test a prototype data index and will continue to research our users. There’s a compelling user need to deliver a solution, but we’re aware that any service needs to be sustainable. We’ll work with as wide a range of colleagues as possible to understand how to achieve this.
Want to find out more about our data index work? Drop us a line at DiscoverDigital@dft.gsi.gov.uk